
Acknowledgements
So many people have helped me over the years. For their help on this thesis, I’d like to thank in particular: Prof Matthew Johnson, Dr Elliot Johnson, soon-to-be Dr Howard Reed, Prof Daniel Nettle, Prof Irene Hardle, and Judith Stark.
1 Introduction
My PhD thesis builds on decades of research conducted as Senior Research Officer at the Institute for Fiscal Studies (IFS), the Open University and as Director of Virtual Worlds. I present three publications developed in my role as Senior Research Policy at Northumbria which emerges from this work. I am a leading specialist in microsimulation modelling of tax-benefit systems, programming software, databases and interfaces. Most significantly, I am the co-creator of TAXBEN (Johnson, Webb and Stark, 1990), the IFS’ tax and benefit microsimulation model (Giles and McCrae, 1995), which continues to be used to analyse Government tax-benefit reform.
Having started my career in Economics at Lancaster University, I spent 18 years as Senior Research Officer at the IFS, before starting my own consultancy, Virtual Worlds. During my time at the IFS, I produced a body peer-reviewed journal articles (listed) and reports that achieved impact with policy makers and Government departments, such as the DSS/DWP and provided rapid response assessment of Budgets for media outlets. In this role, I published highly impactful research with colleagues such as Paul Johnson, Director of the IFS, Andrew Dilnot, Warden of Nuffield College, Oxford, and former Director of the Institute for Fiscal Studies (1991-2002), Principal of St Hugh’s College, Oxford (2002-12), and Chair of the UK Statistics Authority (2012-17) and Evan Davis (e.g. Davis et al. 1992).
After founding Virtual Worlds, an economic microsimulation consultation, I expanded my body of work to examine such issues as tax, social care and legal aid reform at UK and devolved national (England, Scotland, Wales and Northern Ireland) level. I have also provided a range of analyses on tax-benefit reform in other countries, including in the US and low-middle income societies in Africa and Europe. Importantly, I have created a series of online tools that enable users to analyse microsimulation data in accessible form.
Since 2022, I have been Senior Research Associate in Public Policy at Northumbria University, providing economic and microsimulation insight that has fed into a series of peer-reviewed publications, including two that are in press. In this role, I have developed the TriplePC (Public Policy Preference Calculator, https://triplepc.northumbria.ac.uk/), a unique online microsimulation tool that enables projection of the health, health economic, economic and public opinion impacts of customisable welfare policies, which is described in a forthcoming article in the International Journal of Microsimulation (Stark et al., 2024).
This thesis summary is in five sections. Section 2 is a concise resume of my earlier work. Section 3 is a ‘warts and all’ walk-through of the construction of a modern microsimulation tax-benefit model.The final three sections examine the underpinning research from three recent publications that assess the impact post-Financial Crisis era interventions and potential interventions. The first report (Reed and Stark, 2018) forecasts the impact of the Scottish Government’s Child Poverty Plan. The second (Reed and Stark, 2020) assess the impact of policy for care leavers in England. The final report, which summarises the research conducted for Stark et al. (Stark et al., 2024), describes how, building on the model of section 3, I co-developed the TriplePC online simulation as part of a broader NIHR-funded tranche of research on the impact of basic income on poverty, inequality and health.
All the code (though not all the data) for the models used in sections 4-6 is open source and available on the GitHub code collaboration site https://www.github.com/grahamstark. Section 3 has a brief discussion of the merits of open-source development.
2 Microsimulation modelling
Microsimulation Modelling is:
the application of simulation methods to micro data for the purposes of evaluating the effectiveness and improving the design of public policy. The field has existed for over 50 years and has been applied to many different policy areas and is a methodology that is applied within both government and academia. (O’Donoghue, 2014)
The canonical microsimulation is the Tax Benefit Model. A tax-benefit model is a computer program that calculates the effects of possible changes to the fiscal system on a sample of households. If the household sample is representative of the population, and the modelling sufficiently accurate, you can sum the results over the sample to find, for example, the aggregate costs and revenues of the proposal, the numbers of people who are made better or worse off, the effective tax rates faced by individuals, the numbers taken in and out of poverty, and much else.
IFS already had a tax benefit model when I arrived, developed by Andrew Dilnot and Nick Morris and used for the book “The Reform of Social Security”(Dilnot, Kay and Morris, 1984). But it was a hard to maintain piece of Fortran-66 ‘spaghetti code’(“Spaghetti code,” 2024), and after I crashed it live on TV during the BBC Budget 1988 coverage, I persuaded the IFS director to allow me to produce a complete model rewrite that was more reliable and maintainable, and so, working with Steven Webb and Paul Johnson, TAXBEN2, was born. An updated version of that that model remains in use today; 25 years on it still has many technical advantages over competitor models.
2.1 Applications of Microsimulation
(Dilnot and Stark, 1986; Dilnot, Stark and Webb, 1987; Stark, 1988; Johnson and Stark, 1989, 1991)
The most impactful aspect of microsimulation analysis lies in modelling important possible policy changes. (Stark, 1988) analyses the move from taxing husbands and wives jointly to the individual taxation we have today. One consequence of that change was that families with two earners could now receive more tax allowances than families with a single earners, and this paper is one of several I wrote exploring proposed ‘transferrable allowances’ that would address this. As with all the papers I produced during this period, it is possible that some of this analysis seems commonplace now. However, the ability to describe the impact of such changes on the incomes of different types of family, incentives to work, and tax revenues was very new at the time and attracted widespread interest among the media, policy makers, and academics.
For example, (Dilnot and Stark, 1986; Dilnot, Stark and Webb, 1987) are analyses of the now widely-recognised poverty trap. As a family’s income rose from a low level, the withdrawal of means-tested benefits along with increases in taxes could leave them no better off, or even worse off. These papers were the first to show that the numbers of families affected by very high withdrawal rates were at the time likely quite small.
Likewise, (Johnson and Stark, 1991) was the first study of the distributional effects of a UK minimum wage. It showed that the likely gains were mostly amongst second earners in two-earner families, meaning that the gains were predominantly to the middle of the income distribution. This result was not appreciated at the time, but has largely been overtaken by social changes. (Johnson and Stark, 1993) was my attempt at a ‘How to Lie with statistics’ paper specifically about tax policy, and written as a reaction to media coverage of the tax policies proposed in the 1992 general election. (Johnson and Stark, 1989) summarised the entirety of the tax and benefit policy of the Thatcher Government in a concise but consistent way, showing how overall changes were highly regressive. This work, overall, has highlighted the extent to which the 1979-1997 Governments produced significant increases in inequality and presented analysis of means of achieving progressive reform.
2.2 Benefit Takeup and Benefit Complexity
(Fry and Stark, 1987, 1993); Buck and Stark (2003)
The UK’s benefit system is largely means-tested. Entitlement to Universal Credit, Working Tax Credit and the like depend on family income, with benefits being withdrawn as income rise. Along with the Poverty Trap discussed above, the key problem with means testing is that these benefits may not be claimed, largely because of stigma or because of the complexity of claiming them. Ours were the first studies to use microsimulation techniques to study non-take up (Fry and Stark, 1987, 1993). A key result is that takeup is higher for large entitlements, which provides support for the ‘disutility’ model of take-up. Studies using our microsimulation methods have since become a mini-industry ((Brewer, 2003; Ko and Moffitt, 2022)).
Highlighting complexity and stigma as likely important factors in limiting the effectiveness of means-tested benefits has clear relevance to my later work on less conditional welfare reforms, such as basic income, but my initial response was to examine more focused policies such as Legal Aid Means-Testing. Along with Alexy Buck of the Legal Services Commission Buck and Stark (2003),I used microsimulation to answer the question: ‘what is the simplest set of rules that could achieve some set of objectives - the numbers and types of families eligible, overall expenditure and administrative costs and so on?’ The work had significant impact, directly contributing to reforms to Legal Aid means tests, though the positive impact was largely cancelled out by subsequent large cuts to the legal aid budget. Subsequently, there was interest in the simplification question in Government, including an ‘Office for Tax Simplification’. However, this often combined simplification with sweeping distributional changes that produced more complex implementation issues.
2.3 Budget Analysis
One of the key founding missions of IFS was to provide timely, detailed analysis of actual and proposed budget changes. My work with Paul Johnson, Andrew Dilnot, Evan Davis and others illustrate the contribution of microsimulation to this (Dilnot et al., 1987, 1992; Dilnot, Stark and Johnson, 1991; Johnson and Stark, 1993). These, too, may seem commonplace now, although analysis of budgets is mostly focussed on public finances in the aggregate. However, at the time, rapid, detailed analysis of the distributional and incentive effects of budgets was new and had a huge impact in the wider discourse.
My more recent work in this area includes papers for the Office of the Scottish Charities Register (OSCR) , which were concerned with granting charitable status to institutions, such as private schools or golf clubs, that few people could afford (Stark, 2009). I first examined the literature on affordability as applied to, for example, affordable housing, fines levied by the courts and fuel poverty. I then described a microsimulation model that shows the proportions of households who might be able to afford the proposed fees of some applicant for charitable status. Again, I believe this was the first model of its kind.
3 Modelling the ‘Staying Put’ Foster Care Scheme
Staying put is an English scheme that allows foster children to remain with their carers past the age of 18 (DWP, 2013). In this section I discuss an project for the Action for Children on modelling funding for this scheme. There was concern that the scheme was under-funded and consequently that Local Authorities were applying rules inconsistently. I was asked to analyse the likely costs, over 5 years, of uniform payment schemes, funded by central Government.
This work is an interesting example of modelling a clearly important scheme, but with limited and at times inconsistent data. Sometimes you have to do the best you can with what’s available. The accompanying report is light on the details of the work that was actually carried out.
Funding for foster carers is in two parts: an allowance, intended to cover the costs of food, clothing and so on, and a fee. minium Allowances and Fees were set by Central Government for children up to 17, but not for those on the staying put scheme.
In this section I discuss:
- the available data, and how we worked round data limitations;
- our modelling strategy; and
- the assumptions we had to make and the effects of varying those assumptions.
3.1 Data Sources
We used three main sources of data on the existing Staying Put scheme, and on fostering in England more generally:
- The Ofsted “Fostering in England” Series(Ofsted, 2019). Ofsted are responsible for the monitoring of the foster care system in England. Ofsted publish local-authority level information on the performance of foster care services (both Local Authority and private). We use their for some baseline figures for numbers of carers and young people in the system, and we we use Ofsted data to make crude imputations of (e.g) foster carer skill levels;
- The Department For Education (DFE) “Looked-after children” series (DFE, 2019b), (DFE, 2018). In particular we use the “Underlying Data” series which has the most detail available on numbers on the staying put scheme by local authority and age. We use this for entry and exit rates from the scheme, and optionally for some baseline numbers of young people on the scheme, since the DFE numbers appear not to be always consistent with the Ofsted numbers;
- The Fostering Network’s 2017 Survey of local authorities in England (Fostering-Network, 2017). We were given access to the underlying database of this survey, which we use for information on how each English council implements payments for the Staying Put scheme.
In addition we’ve used data on:
- grants to local authorities (DFE, 2019c);
- local housing allowance levels (Agency, 2019);
- minimum wage rates(HMRC, 2019);
- benefit rates (DWP, 2019);
- projected inflation (OBR, 2019);
- recommended minimum foster allowances (DFE, 2019a)
These are discussed below.
Getting all these data sources into a consistent format was not straightforward. The three main sources were at times inconsistent with each other. The Fostering Network data, which is crucial given that it is our only disaggregated source on foster payments, required a lot of interpretation before it could be used.
3.2 Modelling Strategy
We were tasked with providing local-authority and national- level five year forecasts for the costs of the staying put scheme under various possible systems of payment. We built a computer simulation model for this, available on GitHub (Stark, 2019a).
We first constructed a synthetic dataset showing our estimate of the numbers on the staying put scheme by age, and the number of carers by skill level. Each carer and young person was modelled as an individual. The constructed data is based on information from the Ofsted and DFE datasets on the numbers in each local authority in care, and the flows into and out of the staying put scheme. Note that this modelled population can differ from the actual recorded numbers on the staying put scheme, especially, since the numbers in the scheme in each local authority are small and vary randomly from year to year (some years may have an unusually large or small cohort of 18-year-olds, for instance).
We then wrote code which applied rules for payments to each the carer and from the young person in our synthetic datasets; these rules were either our interpretation of the actual rules in place in 2018 from the Fostering Network survey, or the proposed Action for Children reforms.
By comparing the the modelled Fostering Network payments with the reformed payments for each young person and carer, we could then produce a large amount of output on the gross and net costs of each scheme, at the local authority, regional or national level.
I need to make a lot of assumptions for this to work. We discuss some of these assumptions below. Often in modelling work the best strategy is to give a variety of results for different assumptions, and to further account for uncertainty by randomly perturbing the model in various ways and showing average results, as well as the range of possible results.
As with ScotBen, the model is written in the Julia programming language.
3.2.1 Modelling the population of carers and young people
We start with the total numbers of young people in care in each local authority, of all ages.
For this, I needed the number of young people who reach 18 in foster care, and then the numbers of those 18 year olds who opt for the Staying Put scheme.
I experimented with two strategies for estimating the numbers of young people in care reaching 18.
- taking the total numbers in care in each local authority, of all ages, and applying to that an England wide rate for reaching 18 taken from the average of the last 5 year’s Ofsted data. The advantage of this is that smooths our LA level populations out somewhat compared to actual data and thus might perform better in a multi-year forecast;
- alternatively simply taking the reported numbers of young people reaching 18, as reported in either the DFE or Ofsted data. Curiously, the Ofsted and DFE numbers are different from each other, with the DFE numbers typically being higher.
Our main reported results are based in the DFE underlying data, on the grounds that the figures produced using this source seem slightly more compatible with the central government grant determinations (DFE, 2019c) - the other approaches produce more cases where the grant to a local authority exceeds our modelled cost of the scheme, and it’s hard to imagine central Government doing that very often.
Not all young people go on to the staying put scheme, and many go on for only a year or two; we therefore apply local authority level rates for joining and staying in the scheme from the DFE data. In this way our synthetic population of young people are ‘aged’ through the system for 3 years with a proportion dropping out each year. Each year, each young person is randomly assigned to work, education, or ‘Not in Education, Employment or Training’ (NEET) according to frequencies taken from the DFE dataset. For the NEETs only, Housing Benefit (HB) is assigned based on the latest category A Local Housing Allowance[Agency (2019)](Fenton, 2012), and also the £57.90 in Income Support/Job Seeker’s Allowance (JSA)(DWP, 2019) in force at the time. For those imputed to be in work or training, a national minimum wage if 6.15per hour was imputed. No further imputations are made for those assumed to be in education.
For carers, in absence of any other information, I assume one carer per young person Staying Put. Some payment schemes have fees that vary with skill levels; in leu of anything better we impute skills in 5 levels taken from Ofsted data on the numbers of carers approved for different types of care, at the national level, and then randomly assign carers to these levels.
3.2.2 Modelling the payment regimes
The main source of information on how Staying Put carers are actually paid was the raw data from the Fostering Network 2018 survey. The information in that document needed quite a lot of interpretation: whether young people are making a contribution to costs and whether there is a fee payment (a single payment to carers independent of the number of children cared for) in addition to the per-young person allowance. In our modelling of the current system we assume no fee and no contribution unless explicitly mentioned in the spreadsheet. For most councils, we make a simple basic payment calculation based on the reported allowance levels, and we a fuller calculation for those councils which report more detail.
Reformed systems were then modelled by overriding parts of our modelled actual system: forcing contributions from young people, minimum allowances and so on.
3.3 Key Assumptions
Amongst the key assumptions we make are:
- in our modelling of the actual system, contributions from young people are only made when the FN dataset explicitly mentions that a council enforces this;
- for young people imputed to be in further education, no further modelling is done (for example of grants, housing costs, etc);
- housing costs are modelled only for NEET imputed young people, unless the FC spreadsheet explicitly states otherwise;
- money values are generally uprated using OBR forecasts the CPI index (OBR, 2019) (the average increase in this is slightly over 2%);
- wages for young people imputed to be in work are based on a 40 hour week at the National Minimum Wage for young people in force in 2019
- other than the JSA and HB discussed above, we make no further calculations of benefit entitlements or tax/National Insurance payments, for either carers or young people. This is likely most important for the carers rather than the young people, as some may be eligible for tax credits, and the tax system for carers has some interesting wrinkles [DFE (2019a)](DFE, HMRC and DWP, 2013). For young people in staying put, a 40 hours per week job paying the young person’s minimum wage would earn less than the then tax allowance.
Further, I didn’t model any other indirect costs of the scheme, such as additional social workers, or administration and recruitment costs.
I also make a number of random assignments in our modelled population (employment status, skills of carers and so on). To smooth out the effects of these, we run the simulations multiple times with different random draws, and report the average of these. Multiple simulations also allows us to estimate the variability in our results as a result of randomness; these ranges can be very large for individual Local Authorities, though there is of course less variation in the all-England results. These random variations are of course not the only source of uncertainty here - there are also all the modelling assumptions I’ve detailed above.
3.4 Reflections
The day I went to London to present the findings of the report at a meeting at the Department for Education was the day before the first Covid lockdown was announced. This work seemed well received but with the pandemic Government and Local Authorities likely had other things on their minds. In the event, a uniform scheme has never been introduced and the Central Government funding for Staying Put remains much as it was (Education, 2022). You can’t win them all. Nonetheless I feel the work is a good example of pragmatic microsimulation, making the best I could with limited information to attack an important question.
4 Forecasting Child Poverty
In 2017 Howard Reed and I were commissioned to produce a report forecasting Child Poverty in Scotland from 2016-2030(Reed and Stark, 2018). In this project, the division of labour was that Howard would do the microsimulation modelling using his Landman Economics tax-benefit model (Reed, 2018) using datasets that I would produce that represented the likely Scottish population in those years, given what was known or assumed about trends in demographics and incomes.
The Landman model used pooled Scottish subsets of the Family Resources Survey (FRS). Such surveys are voluntary; unlike the Census, no-one can be compelled to participate in the FRS or LCF, and indeed only about 50% of those approached agree to. (Participation in the Family Expenditure Survey, the predecessor to these surveys, was over 80% in the early 1960s, but participation has declined steadily ever since; this decline seems to me to be both important and under studied). If non-participation was random, this wouldn’t pose much of a problem for single period analysis, but in reality some types of household are much less likely to participate - those with high incomes, or sick or disabled members, for instance. This is response bias. A way around this is differential weighting. If, because of response bias, a dataset sampled 1 in every 100 working aged adults, but 1 in 200 pensioners, we could simply gross up each working aged person by 100, but each pensioner by 200, and that would give us the correct total for each group. For this to work, of course, we need some external source of information on what the actual number of pensioners and working age adults should be; information like this typically comes from the Census (which should in principle include everybody) or other official sources such as tax-returns or the electoral roll. In practice things are more complicated than this, because there is response bias in multiple dimensions - not just by age, but also income, health, location, and other characteristics. Methods exist that can calculate weights that will allow a dataset to be grossed up so as to give correct totals for multiple sets of targets. Two good discussion on these techniques are (Creedy, 2003) and (Creedy and Tuckwell, 2003). I developed my own implementation of these techniques for this project [Stark (2019b)](Stark, 2022).
Using survey data weighting for forecasting is then a conceptually simple extension of this: instead of grossing up to current know values, gross up instead to some projections of future employment, population totals and the like.
The report mentions and then dismisses an alternative approach: artificial ageing, in which you add a year to each individual in the dataset, and then impute a new state to that individual by applying statistical models giving the probability of events such as death, illness, unemployment, etc. That’s a useful approach when you want to track individuals over time - to model pension contributions for instance - but there was no real requirement for that in this project. Ironically, Howard and I had just finished working on two artificial ageing projects, one one Social Care in Wales (Stark, 2019c) (the other is not open source for contractual reasons). However, that was modelling social care for the elderly which is conceptually and practically easier than modelling child poverty this way because all us elderly people do is get sicker and die, and those are easy to model given a suitable data source such as the the English Longitudinal Survey of Ageing (ELSA) (ELSA, 2019), whereas to capture the dynamics of children in poverty you have to model family formation and dissolution, childbirth and the like.
My side of the project then consisted of trawling through Scottish and UK forecasts for populations, household sizes, and employment, building the results into a relational database, and running those projections and FRS data through the weights-generation algorithm. The appendix to the report covers the sources in detail and I shan’t repeat it here.
4.1 Conclusion
Although my part was technically straightforward, this was a genuinely impactful piece of work of which Howard and I remain very proud. Within a year the Scottish Government had introduced its Tackling Child Poverty Plan (Government, 2021, 2024), and this has had a significant impact, most obviously through the new Scottish Child Payment benefit (SPICe, 2021).
As an aside: my experience on this project helped convince me that I needed to change the way I worked towards a more data-science-like approach, and that I wanted to build the Scottish Tax Benefit Model described in section 3. Looking at the code for this project now, the Ada language I used is very robust and clear, but an absurd amount of the code is field-by-field communicating with a database; the Julia language I now use can do all that in a single line using its DataFrames package (Kamiński, Bogumił, 2024).
5 Microsimulation of policies for which there is no precedent: basic income
Prospective welfare policies have often been assessed on their financial impacts, for example, their effects on net household incomes and marginal and average tax rates. However, welfare policies can also have a substantial effect on population health and wellbeing. In addition, politicians must consider the electoral implications of policies that would affect large sections of the population. In my third report, Treating Causes not Symptoms (Johnson et al., 2023), I describe the Public Policy Preference Calculator (TriplePC), a new microsimulation model that seeks to extend the microsimulation in two ways:
First, as well as modelling the outcomes of a policy in the conventional way, our model uses Conjoint Analysis of public acceptability data to give an indication of the policy’s popularity. This is novel and important. There are measures that might actually be popular with , but which policymakers have been unwilling to touch because of uncertainty about their electoral consequences. Perhaps the best example from UK history is the SDP/Liberal Democrat’s ‘Dead Parrot’ merger manifesto of January 1988 (Crewe and King, 1995a; Gourley, 2020), which proposed the abolition of Child Benefit and the imposition of a uniform rate of Value Added Tax (VAT) to raise money for an anti-poverty program. Although this had been modelled in detail, fear of the electoral consequences among Members of Parliament meant the manifesto was abandoned within a day. The resulting confusion and indecision arguably caused long-lasting damage to centrist politics in the UK (Crewe and King, 1995b). The UK’s zero-rating for food and children’s clothing remains politically untouchable to this day despite the orthodox economic arguments in favour of a uniform rate (Crawford, Keen and Smith, 2010). But would VAT extension really be unpopular, especially if it was part of a package that used the money raised for poverty reduction or other appealing policies? Our approach allows us to address questions like this.
Second, health outcomes are integrated into the model. There are existing health simulations for the UK. Public Health Scotland’s Informing Interventions to reduce health Inequalities (Triple I) tools focus on comparing the effects and costs of a range of tax-benefit (including a Basic Income) changes as well as non-economic programmes such as a lifestyle weight management service, 20-mile-per-hour speed limits or Alcohol Brief Interventions. Effects and costs modelled are based on premature deaths, years of life lost and hospital stays, with changes population health and inequalities as the key measures. It does not model the economic impacts on household types nor public preferences.
My colleagues and I therefore created the Public Policy Preference Calculator (TriplePC) – a simulation that would enable automated assessment of economic and health impacts as well as public preferences between different welfare and tax policies. The project had three strands:
- Estimating the likely electoral popularity of possible policies
- Deriving relationships between income and health, in a form suitable for use in a microsimulation
- The integration of strands 1 and 2 into a microsimulation tax-benefit model
We discuss these in turn.
5.1 Public preferences: Conjoint analysis
Conjoint analysis (Hainmueller, Hopkins and Yamamoto, 2013) is a survey-based technique originally developed as a market research tool, to examine how consumers value characteristics (sweetness, colour, alcohol content, etc.) of goods. Recently, the technique has become popular as a method for discovering the public’s relative valuations of competing economic or social policies (Bremer and Bürgisser, 2023). Research comparing conjoint survey experiments to actual votes has shown that the conjoint results are good predictors of voting outcomes (Bansak et al., 2023).
Our study is described in full in (Nettle et al., 2023). We recruited 800 UK resident adults through the Prolific online platform. Participants were asked repeatedly to choose their preferred welfare policy from sets of two. Each time, the two policies contained the same input (design) and outcome (health and distributional) attributes but with randomised levels in each (e.g. payment sizes of £63 per child, £145 per adult and £190 per pensioner; poverty decreased by 25% etc.). Each participant completed 15 choice tasks. Each option within each task was defined by 10 attributes. Each attribute had three to nine possible levels.
Relative to the UK population, the sample contained an over-representation of people who voted for the left to centre-left Labour party at the 2019 general election (44.3% of those in our sample who voted, vs. 32.1% election result); and an under-representation of those who voted for the right to centre-right Conservative party (31.8% versus 43.6% election result).
All options were fully randomly generated from the possible combinations. Instructions in the survey explained that participants might prefer some features in one policy and some in the other, but they needed to consider which policy they preferred overall. The attributes on which the policies varied were explained in greater depth prior to the first choice task, and then described just with brief phrases during the choice tasks themselves. Note that many of these randomly generated pairs are totally implausible. This is integral to how a fully randomized conjoint analysis works: by generating all the possible combinations, things that are actually correlated in real life (e.g. tax rates and poverty rates) are rendered orthogonal to one another. It is this that allows identification of their independent marginal effects.
We simultaneously estimated the average impact of preference or dis-preference for particular feature attribute-value on preference for policies overall using comparable scales through computation of Average Marginal Component Effects (AMCEs)(Hainmueller, Hopkins and Yamamoto, 2013) from linear probability models. The AMCE for a given level of an attribute can be interpreted as the marginal effect on the probability of choice of the attribute being at that level compared to the reference level, averaging across the possible levels of all other attributes. Through randomization and a high number of pairwise comparisons, this allows us to quantify the causal effect of including specific levels of individual reform elements on the support for the entire reform package, compared with the support for a reform package that contains the baseline level (status quo) of this particular reform element (Nettle et al., 2023a). That study found:
- preference for more generous payments than less generous ones.
- strong preference for decreases in poverty (compared to the status quo).
- preferences on tax rates depended on the broad effects of the policy package. Increasing personal income tax rates were popular if the package they were part of also decreased poverty, and unpopular otherwise.
- preference for a wealth tax, carbon taxes, and increased corporation tax, as opposed to increased government borrowing.
- significant positive effect of a large reduction in inequality, and a significant negative effect of a large increase in inequality. However, the effects for inequality were weaker than for poverty.
- other health and wellbeing consequences also had some significant marginal effects above and beyond those of poverty and inequality. An increase in life expectancy of five years was significantly preferred to the status quo, and a decrease in life expectancy of five years significantly dis-preferred.
- dis-preference for increased rates of anxiety and depression relative to the status quo, and there was a slight preference for policies that decreased them sharply.
- no strong preference for or against means-testing or other restrictions on eligibility.
- Mild differences between left- and right- supporting participants, in the expected directions.
- no significant variation by gender or between rich and poor.
- older people were significantly less keen on high income tax schemes and, curiously, less concerned with heath consequences.
For the TriplePC, we extract the AMCEs for each component of any welfare policy the user wishes to specify through the interface from the data of Nettle et al. [Nettle et al. (2023);nettle_sp21_2023]. In the conjoint methodology, these are assumed to have an additive effect on popularity. That is, for example, the popularity of a policy combining high income taxes, carbon tax, and a decrease in poverty will be the sum of the negative marginal effect on popularity of the high income tax, the positive marginal effect on popularity of the carbon tax, the positive marginal effect of the poverty reduction, and so on. This summation is the popularity outcome returned by the model.
The conjoint analysis was conducted ahead of the construction of the microsimulation model. As we discuss below, some of the measures used (income tax, payment sizes, poverty and inequality rates) are reasonably straightforward to model (though there are issues around definitions). Others, such as the ‘other funding’ options and the relationship between income and health, are harder.
5.2 Modelling health outcomes
The modelling work on health outcomes was principally carried out by Howard Reed; my responsibility was principally to take the results of that analysis and integrate them in the TriplePC model. (I did however have input into choice of variables used, so that the integration was practically possible). Health modelling is discussed in detail in (Johnson et al., 2023; Reed et al., 2024) and will not be repeated here.
In summary, we model two health measures: mental health and life expectancy. We build a model relating SF-12 scores (Ware et al., 2002) to income and demographic characteristics. SF-12 is a widely used measure of an individual’s health-related quality of life, with two summary scores: the Physical Component Summary (PCS-12) and the Mental Component Summary (MCS-12). The model is estimated over 12 waves (2009/11-2020/22) of Understanding Society: The UK Household Longitudinal Study (UKHLS)(Social and Economic Research, 2024) panel data (Reed et al., 2024). The health model is estimated using the ‘between’ individual coefficient from a fixed effects ‘within-between’ model, which combines the effect on physical and mental health of both an individual’s income in one wave vs their average across waves, and their average across waves compared with the sample average.
5.3 Microsimulation: The TriplePC model
In conjoint surveys, respondents have preferences over inputs (income tax rates, payment sizes, etc.) and outcomes (poverty and inequality levels, numbers of mental health cases, etc.). We use microsimulation to bridge between them.
The analysis uses a version of the ScotBen discussed in section 3 above, adapted to use a UK dataset and with several new modules added, and a web interface.
A particularly tricky question arising from the conjoint survey is how to establish a baseline for comparison. The conjoint experiment survey had no ‘keep things as they are’ option for the tax and benefit inputs, so there were two options for the TriplePC:
- Using a tax-benefit system some way from the current one as baseline and assuming that the outcome changes represent changes in poverty, health, etc. from that point, rather than changes from the actual current situation.
- Using the current system as the baseline, but then the default output will have significant deviations for the outcome variables.
Neither of these choices is good but on balance we decided 1) was the least bad. I It makes the conjoint popularity output much easier to understand: with option 2) we would be applying large changes in poverty and inequality to the base conjoint results which would make those results very unintuitive. The result, however, is that the model starts some distance from the actual existing system. This is certainly a lesson for future work.
5.3.1 Income tax rates
The conjoint experimental survey had six income tax rate options with a basic, higher and additional rate in each (see Table 1). The first of these options is the current non-Scottish UK income tax rates, which we take as the base. All other options represent rate increases. We assume the corresponding thresholds are as present. Since we have to remain consistent with the conjoint analysis, only the values used in the Conjoint survey are presented to the user.
5.3.2 Benefits
The payment size question in the conjoint survey was about a hypothetical system of payments that most closely reflects the simplicity of Basic Income (Reed et al., 2023). There were also questions about eligibility, means-testing and citizenship. It is not clear how this proposed system of cash transfers should interact with the existing tax and benefit system, especially bearing in mind that the question is not how an expert believes they should interact, but what was most likely in the mind of the conjoint respondents. We follow our recent analysis (Johnson et al., 2023; Reed et al., 2023) and assume:
- means-tested benefits are retained.
- most other benefits, including the State Pension and Child Benefit, are abolished and replaced by the cash transfers.
- Needs-based benefits such as those based on sickness or disability, like Personal Independence Payment (PIP), are retained.
The least generous set of options (Child - £0; Adult - £63; Pensioner - £190) are taken as the base values. Compared to the actual system, this means that we’re starting from a social security system that’s considerably more expensive (because of the adult payments), but where pensioners are usually slightly worse off (£190 vs £203.85 for the new State Pension) and families with large numbers of children not on means-tested benefits are worse off, since the cash transfer to children is zero in the default case and the payments to adults are not always enough to compensate. We do not adjust taxes to meet these extra base costs.
5.3.3 Modelling other funding options
The Conjoint survey included a number of ‘other funding’ options that are worth discussing briefly.
5.3.3.1 ‘Increase in VAT’ (Value Added Tax)
Our Family Resources Survey (FRS) dataset has no expenditure data. The main UK source of household expenditure data is the Living Costs and Food Survey (LCF) (National Statistics, 2019). To model the complex set of VAT exemptions and zero-rated goods we matched in LCF records to the FRS; the matching procedure used for this is discussed in section 3 above.
5.3.3.2 ‘Tax on wealth’
Modelling wealth is tricky for three reasons:
The Wealth and Assets (WAS) imputation procedure we used here is also discussed in section 3.
For the form of the tax, we were guided by the Wealth Tax Commission (Advani, Chamberlain and Summers, 2020). We followed their recommendations of excluding pension wealth, having an allowance of £500,000, and having the tax payable over five years, though we deviated from the Commission in applying the tax to aggregate household wealth rather than individual wealth (Chamberlain, 2020).
Even when payable over five years, as recommended by the Wealth Tax Commission, the payments from wealth taxes needed to fund some of the more generous benefit schemes can exceed net income for many families, especially elderly families who have high housing wealth. Most likely the scheme would need to be augmented by an income-related rebate scheme, or some scheme to defer until death.
5.3.3.3 ‘Corporation tax increases’
Building a plausible micro-data based model of Corporation Tax is difficult and not something that could be contemplated for this project. In any case, for a household-based microsimulation model, what matters is the incidence of the tax on the households. This could be on profits, or passed on in price increases or real wage reductions (Harberger, 1962; Atkinson and Stiglitz, 2015). If we make a simple ‘small country’ assumption – that the rate of return on capital and the price of tradeable goods are set exogenously on world markets – then Corporation Tax is ultimately incident on (private sector) wages and self-employment income. Therefore, we calculate the tax increase needed to meet the costs of the benefit increase and reduce the wage bill by that amount. Note that as the wage bill falls, direct tax revenues also fall, but in a non-linear way because of the tax allowance and progressive tax rate structures, so finding the correct Corporation Tax increase requires the use of our root-finder. In practice the rates needed for the more generous benefit increases can be implausibly large, exceeding in some cases total UK Corporation’s Gross Profits.
5.4 Model flow
Putting all this together, a model run has five main stages:
- The user selects from the Payment size, Income tax, Other funding, Conditionality, Means testing, Universality options from Table 1.
- The model then calculates net incomes for each person in the FRS households given these choices.
- These net incomes are in turn plugged in to the equations discussed in Section 2 to give us estimates of changes to the prevalence of depressive disorders and mortality.
- The model next calculates gainers and losers, revenues and costs, and changes in poverty and inequality.
- Finally, the model calculates conjoint public preferences based on 1 to 4 above and displays the results.
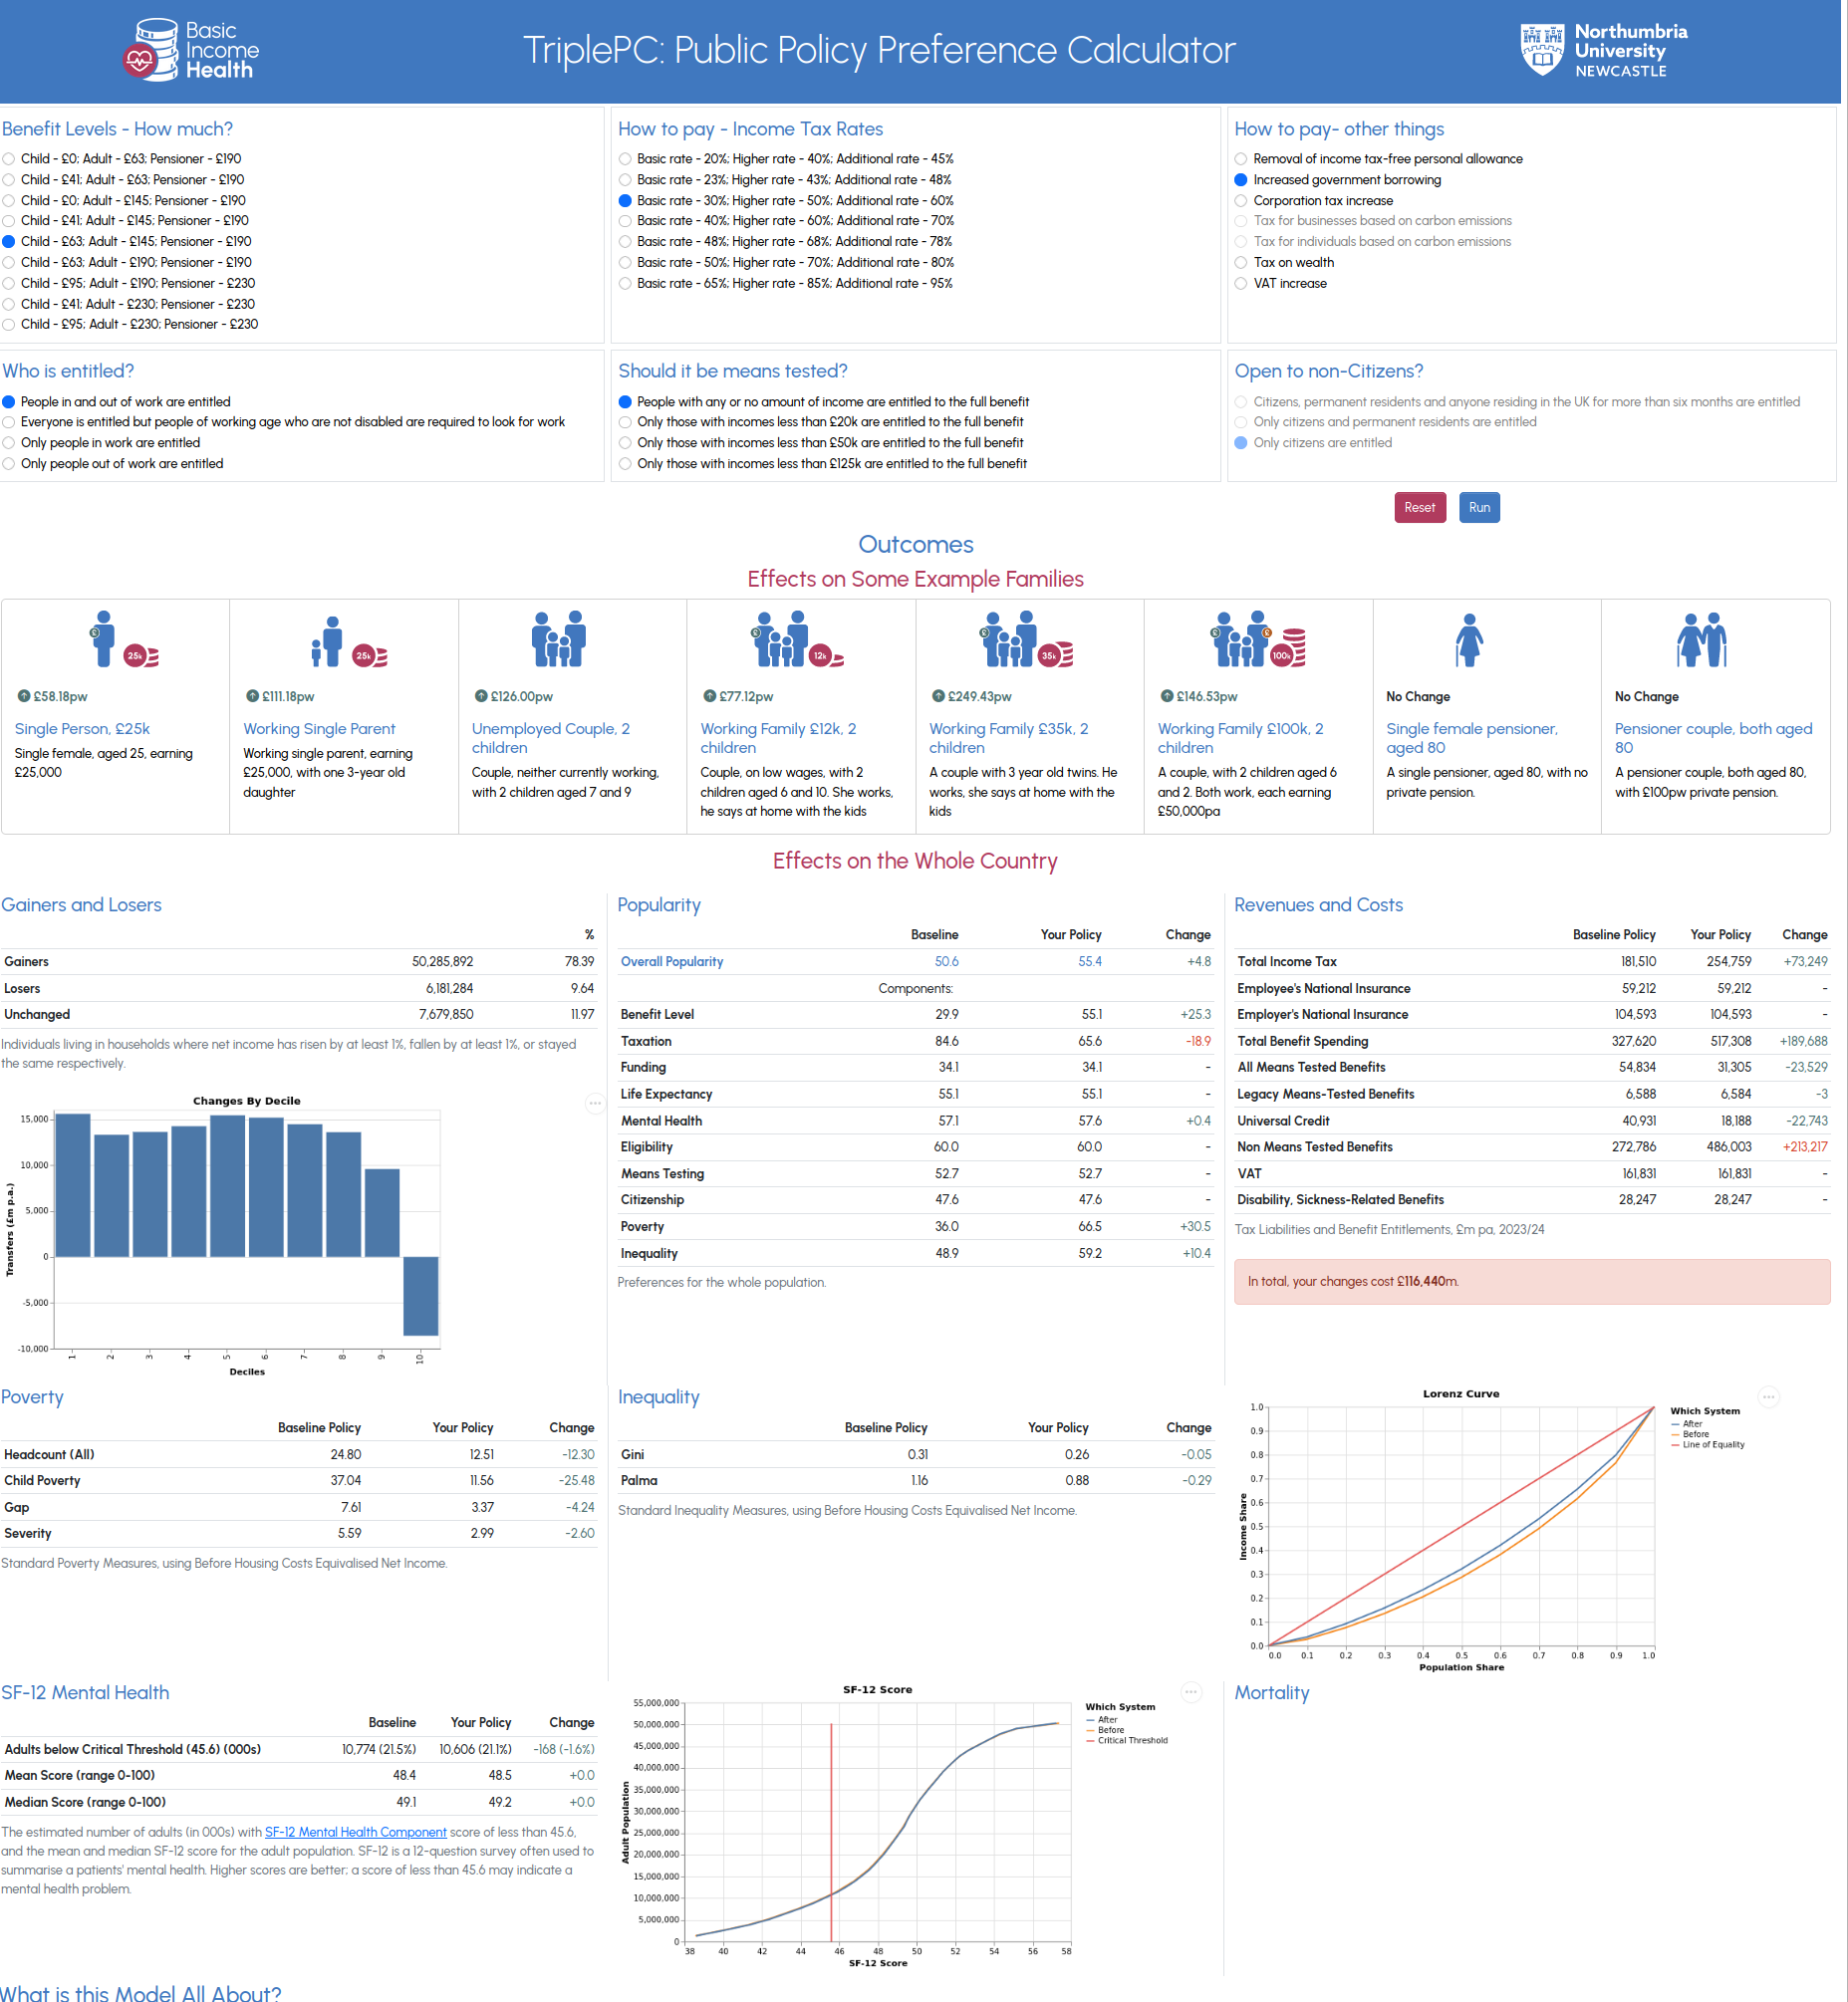
The model has a simple single page web interface, publicly available at https://triplepc.northumbria.ac.uk/. Figure 1, below, shows this in action. The user has selected a relatively generous benefit increase (top left panel), partially paid for by income tax increases (top centre). The bottom half of the screen shows the results, relative to the base discussed in section 3 above. Health results are in the bottom row, showing small mental health improvements. The net cost of this scheme is £118bn (right middle panel). Poverty and inequality are both reduced (centre left panel). The Conjoint analysis is in the centre: the scheme is more popular by 4.7 points than the baseline due to the popularity of the poverty and inequality reductions and the benefit increases, though this is partly offset by unpopular tax increases.
5.5 Reflections
One important lesson for similar future work is the need for good coordination between conjoint analysis and microsimulation modelling at the outset of the project.
In our case, the conjoint analysis was conducted ahead of microsimulation modelling work. Consequently, microsimulation requirements were largely fixed by the questions in the conjoint survey. This has several consequences:
- The model could present only a very limited set of options for taxes and benefits compared to the model’s underlying capabilities. The survey system used for the survey – Qualtrics – had a hard limit on the number of attributes that could be included, which meant that it was not possible to ask about basic and higher tax rates individually. It might also have increased respondent load to an unacceptable level and therefore reduced the quality of the preference data.
- The meaning of options such as ‘Tax on wealth’ should, where possible, be made clearer in order to provide a clear direction for modelling.
- Co-development of a conjoint survey and microsimulation might have enabled respondents to see accurate consequences of their preferred policies for incomes and health.
- Some of the options in the survey, such as VAT increases, were quite burdensome to model in the time available.
- Careful thought must be given to the definition of the base case the model is comparing against.
There are also interesting questions about how best to present results of a model with such diverse outputs. For instance, since one is a stock and the other a flow, can we count payments by a household from a wealth tax in the same way as payments for income tax? And should we be imputing a monetary value to any health improvements?
6 Conclusion
In this submission I’ve surveyed highlights from pretty much a lifetime’s work (though I hope to contribute to Northumbria for many years to come). Looking over it now, my main feeling is gratitude that I was given the chance to work on so many interesting things with so many wonderful people. And looking back on them, now the stress of producing them has long faded, I’m quite proud of some of this stuff. Sometimes I’ve helped make a practical difference to the world - which ultimately has to be the point of it all - and sometimes that hasn’t happened. I hope (but doubt) this submission conveys just a little of how much fun all this ultimately was.
7 References
Reuse
Citation
@online{stark,
  author = {Stark, Graham},
  title = {Some {Applications} of {Microsimulation} {Modelling}},
  doi = {https://virtual-worlds.scot/phd/index.html},
  langid = {en},
  abstract = {In this submission I discuss my career in microsimulation,
    with detailed discussion of three recent examples: costing foster
    care, projecting child poverty and building TriplePC, a new
    microsimulation based in Northumbria with some interesting new
    ideas. I also show how a new, large, tax-benefit model of Scotland
    was built and tested.}
}